

By Dr. Nikolaos Arvanitidis, Economic Geologist
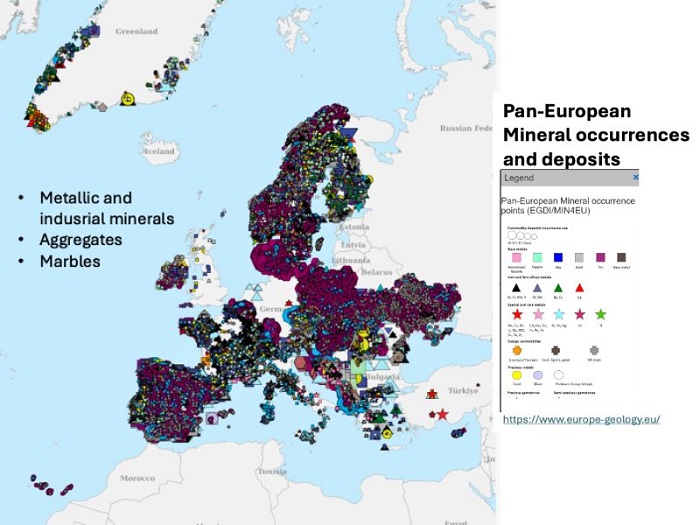
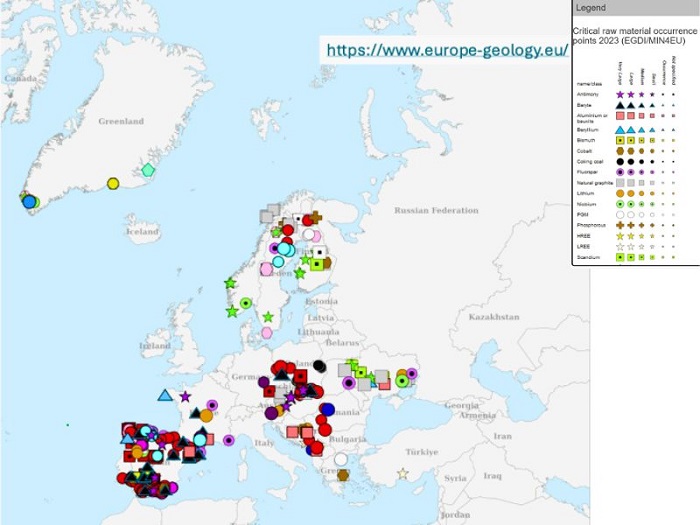
Adequate access to mineral raw materials (MRMs) is essential for stable and sustainable economic development. Europe’s potential to become self-sufficient, resilient, and sustainable—based on the productive exploitation of its own MRM deposits—is largely supported by its geology and metallogenetic evolution (Figs. 1 & 2). Despite this, broader geopolitical tensions—such as protectionist measures, selective trade restrictions, complex dependencies, and intricate value and supply chains—make access to certain MRMs vulnerable and often lead to production deadlocks. These trends have greater implications for strategic autonomy and independent value chains, especially concerning access to Strategic and Critical Mineral Raw Materials (SCMRMs), ultimately limiting the capacity to effectively address technological challenges linked to the energy transition and the digital economy.


In line with the above, it is widely accepted that statistical databases regarding the production, market trends, and commercial value of MRMs constitute a key tool in shaping strategy and policy. They support appropriate decision-making and the implementation of effective actions.
The Austrian Federal Ministry of Finance recently published the World Mining Data report, which provides a range of updated statistics on global MRM production (2). The data presented are categorized into five main groups: Ferrous Metals, Non-Ferrous Metals, Precious Metals, Industrial Minerals, and Fossil Fuels (Table 1).
| Group | Mineral Raw Materials (MRM) |
|---|---|
| Ferrous Metals | Iron, Chromium, Cobalt, Manganese, Molybdenum, Nickel, Niobium, Tantalum, Titanium, Tungsten, Vanadium |
| Non-Ferrous Metals | Aluminum, Antimony, Arsenic, Bismuth, Beryllium, Bismuth, Cadmium, Copper, Gallium, Germanium, Indium, Molybdenum, Lithium, Mercury, Rare Earths, Rhenium, Selenium, Tellurium, Tin, Zinc |
| Precious Metals | Gold, Platinum Group Metals (Palladium, Platinum, Rhodium), Silver |
| Industrial Minerals | Asbestos, Barite, Bentonite, Boron Minerals, Diamond, Feldspar, Fluorite, Graphite, Gypsum and Anhydrite, Kaolinite, Magnesite, Perlite, Phosphorites, Potash, Salt, Sulfur, Talc, Vermiculite, Zirconium |
| Fossil Fuels | Coal, Lignite, Natural Gas, Petroleum, Uranium |
Table 1. MRMs included in the five groups as classified in the World Mining Data report (2).
The data include both extracted quantities and the produced concentrates. The collection of information on MRMs and SCMRMs was based on questionnaires sent to the national committees of World Mining Congress member countries, as well as to other institutions such as embassies, foreign trade representatives, etc. The compiled data were cross-checked with those of the British Geological Survey (World Mineral Production) and the USGS. The data evaluation also considers additional influential parameters such as political stability and specific developmental and economic indicators of the listed countries.
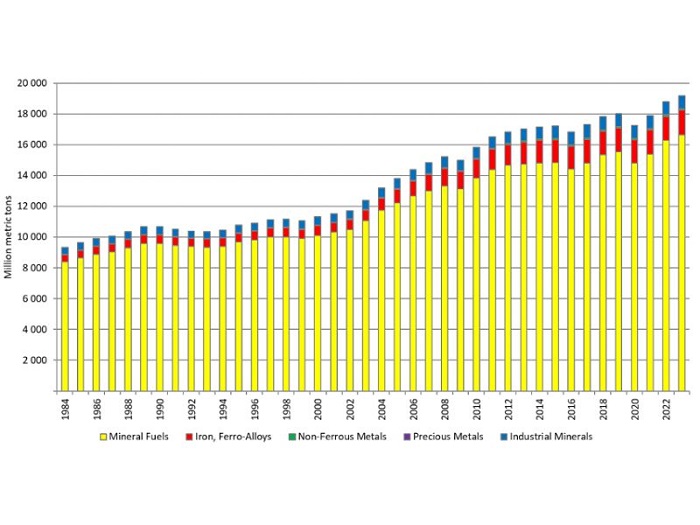
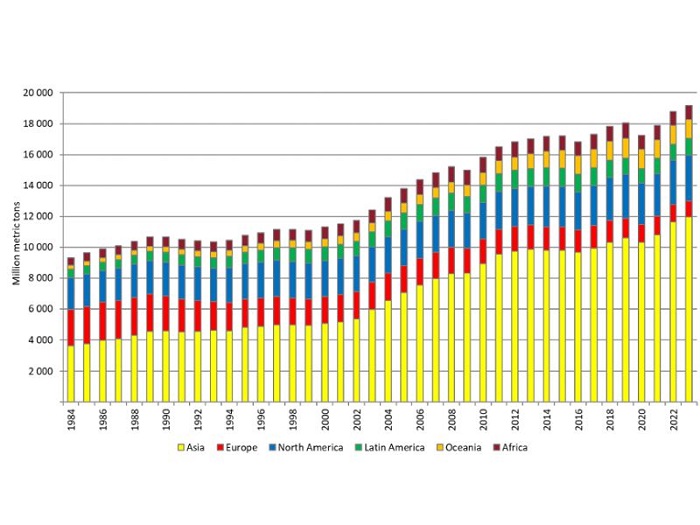
Overall, between 1984 and 2023, global MRM production has increased, led primarily by fossil fuels (Fig. 3), although Europe’s contribution shows a declining trend (Fig. 4).
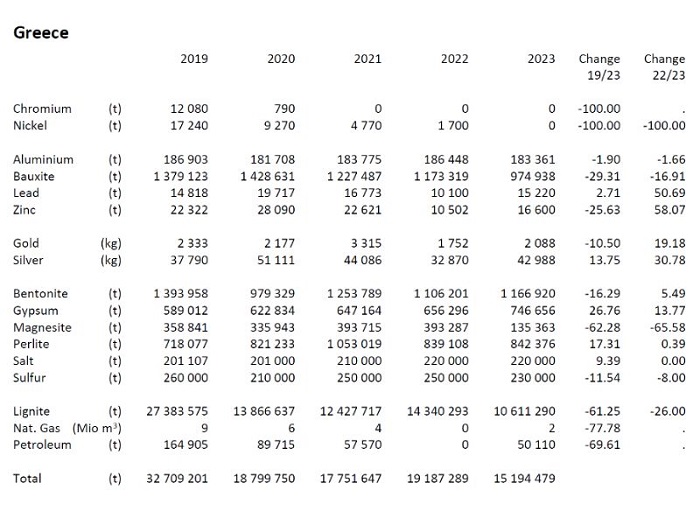
According to 2023 data, China is the world’s largest producer of MRMs, with production levels double that of the second-ranking country, the United States, and nearly triple that of third-place Russia (2). The report includes production data for 65 MRMs from 168 countries. Greece’s data from 2019 to 2023 are summarized in Table 2, including fluctuations and production trends.
| MRM (Mineral Raw Material) | 2019 | 2023 | Global Ranking | Data Source |
|---|---|---|---|---|
| Nickel | 17,240 | 0 | 14th (among 24) | Questionnaire |
| Bauxite | 1,379,123 | 974,938 | 14th (among 24) | Questionnaire |
| Molybdenum | 14,818 | 15,200 | 27th (among 49) | Company Reports |
| Zinc | 22,322 | 16,600 | 37th (among 54) | Company Reports |
| Gold | 2,333 | 2,088 | 63rd (among 101) | Company Reports |
| Silver | 37,790 | 42,988 | 34th (among 97) | Company Reports |
| Bentonite | 1,393,958 | 1,166,920 | 6th (among 47) | Questionnaire |
| Gypsum & Anhydrite | 589,012 | 746,656 | 28th (among 79) | Questionnaire |
| Magnesite | 358,841 | 135,363 | 13th (among 22) | Questionnaire |
| Perlite | 718,077 | 807,216 | 2nd (among 11) | Questionnaire |
| Salt | 201,107 | 220,000 | 50th (among 86) | Company Estimate |
| Sulfur | 260,000 | 0 | 33rd (among 55) | Company Estimate |
| Lignite | 27,383,575 | 20,611,290 | 16th (among 29) | Questionnaire |
| Natural Gas | 9 | 2 | 91st (among 119) | Questionnaire |
| Oil | 164,905 | 50,110 | 86th (among 99) | Questionnaire |
Table 3. Production changes and global ranking of Greece’s main MRMs (in metric tons; multiply by 0.907 to convert to short tons. Gold and silver are shown in kilograms).
Table 3 highlights the leading role of Greek bentonite and perlite in this statistical framework. The data sources, i.e., how the data were provided and collected, are also noted. While maintaining caution regarding the accuracy, validity, and reliability of the data provided for Greece in this report, the fact remains that it is an international publication already gaining global circulation.
Sources