


Following our previous report on Greece’s marble exports growth during the first half of 2019, Stonenews.eu is presenting the up-to-date growth statistics plus the three months till September 2019. The original data are derived from Eurostat (last update 15/11/2019).
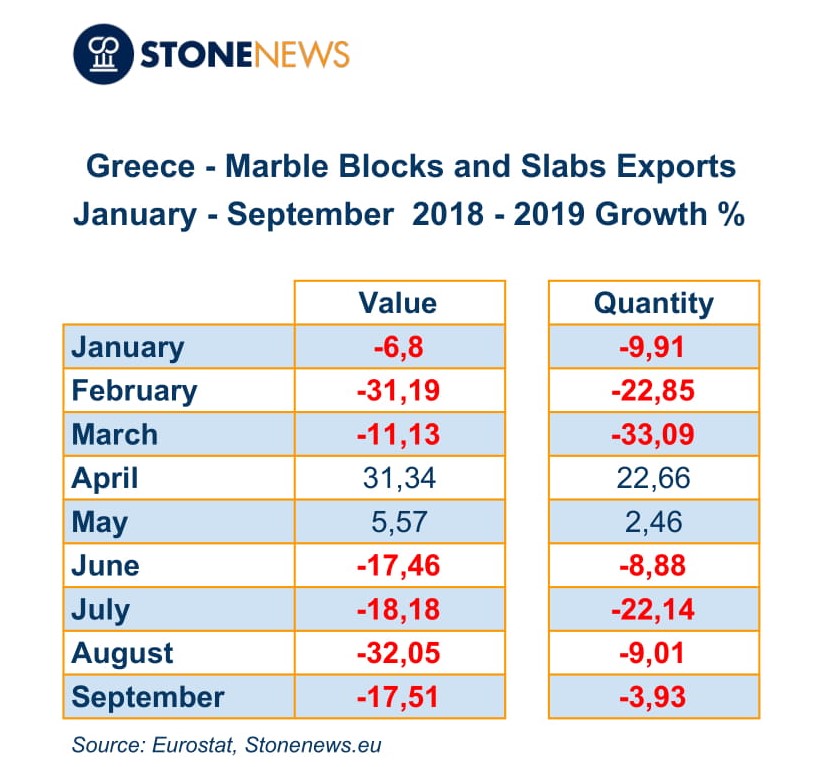 The table above shows Greece’s marble blocks and slabs growth both in value and quantity of exports, from January to September 2019, compared to last year’s same period of time. April and May were the only months with an increase both in value and quantity of exports, while in the rest of the months both the parameters had a general fall from last year. More specifically, February and August suffered the largest slump in export value, almost one third down of the previous rates. As for quantity of exports, March dropped by -33%, having the greatest decrease.


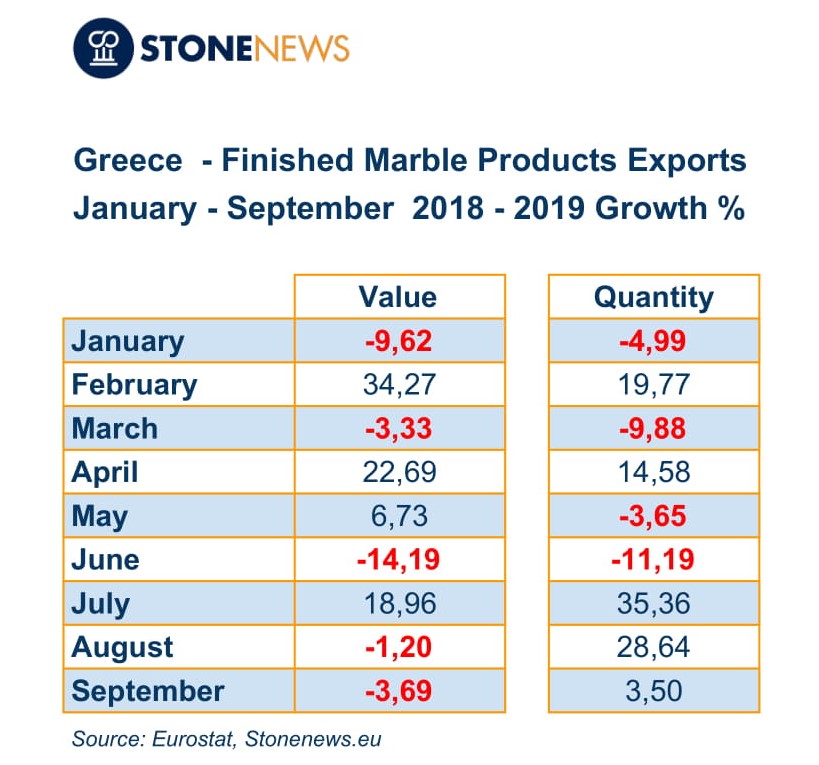 The second table shows Greece’s finished marble products growth both in value and quantity of exports, from January to September 2019, compared to last year’s same period of time. Finished marble products exports had many fluctuations: from month to month a decrease was followed by an sharp increase only to be followed by a sudden decrease again. February is the champion of positive growth in export value and July in quantity of exports. On the contrary, June suffered the greatest fall in export value as well as in quantity of exports.
It is worth mentioning that during the first nine months of 2019, Greece managed to export marble blocks and slabs of 185.88 million euros worth against 210.95 million of the previous year as well as finished marble products of 109.17 million euros against 103.72 million euros in the first nine months of 2018.
*Due to consistent data flow, statistics may alter during the year