


The Red Sea crisis has forced shipping lines to sail around the Cape of Good Hope, increasing sailing distances and de facto increasing transit times as well. Care must be taken while looking into transit times, as headline grabbing numbers may be technically feasible, but often come with a caveat, they are on uncompetitive port-pairs that are not marketed by carriers as such. For an apples-to-apples comparison, we need to look at the shortest actual transit times for a port-pair i.e., the minimum transit time.
As such, from the two sub-regions of Asia (North & South East Asia) and to the three sub-regions of Mediterranean (East, West, & Central MED), the average minimum transit time in the three months since the crisis (January-March 2024) increased by 39%. This is compared to a six-month baseline (July-December 2023), counted across the four most-connected port-pairs across each region pair. Asia-North Europe fared better in that respect, as the increase was lower at 15%. In a nutshell, what this means is that the most competitive transit time increased on average by 39% on Asia-MED and by 15% on Asia-NEUR.


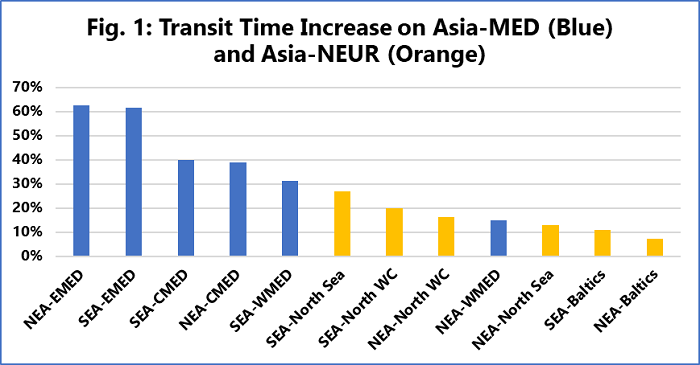
Figure 1 shows this broken down into the sub-region combinations. The four most impacted subregion-pairs connect to East and Central Mediterranean, which makes sense, because those connections had the longest detour. The average minimum transit time increased by 61%-63% to East Mediterranean and by 39%-40% to Central Mediterranean. For North Europe, connections to the Baltics had the smallest impact on transit times from the Red Sea crisis, with the average minimum transit time increasing by 7%-11%.
Source: Sea‑Intelligence