


How did the COVID-19 pandemic and the trade war affect US imports of finished marble and granite in 2020?
Imports of finished marble and granite imports in 2020, recently published by the United States Census Bureau, show the strength of the world’s largest economy. In the midst of the trade war and the COVID-19 pandemic, which hit and affects more than any other country in the world, the USA maintained its imports at high levels, recording a relatively small decline compared to 2019.


Marble
In the imports of finished marble between 2019 – 2020, the USA recorded a decrease in value by -5.88% while in quantity they increased by + 3.25%. In the Table below we see in detail the monthly changes (%) in imports.
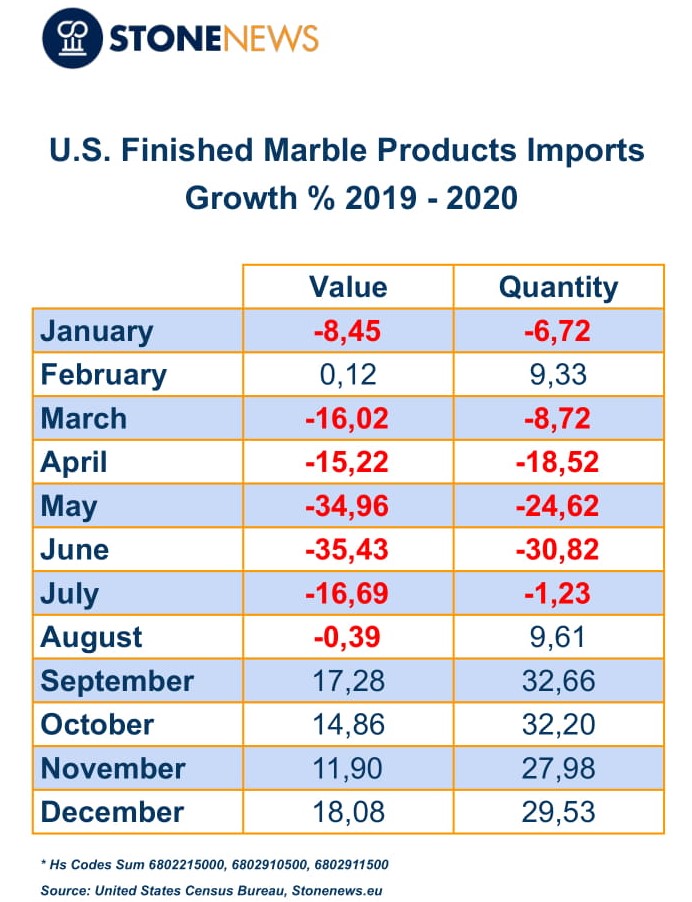 In the Table we observe the fall of the first half and the rise of the second. Between January – June 2020 there was a decrease in value by -33.33% and in quantity by -13.46%. On the contrary, between July – December an increase of + 27.27% was recorded in value and in quantity + 16.01%.
In the States with the highest value of imports in 2020, Texas is the only State that recorded an increase of + 6.18% while New York recorded the largest decline with -16.31%. In the other states, Georgia, Florida -3.52% and California -6.8% recorded a marginal decline of -0.88%.
Granite
In the imports of finished granite between 2019 – 2020, the USA recorded a decrease in value by -7.48% and in quantity by -7.04%. In the Table below we see in detail the monthly changes (%) in imports.
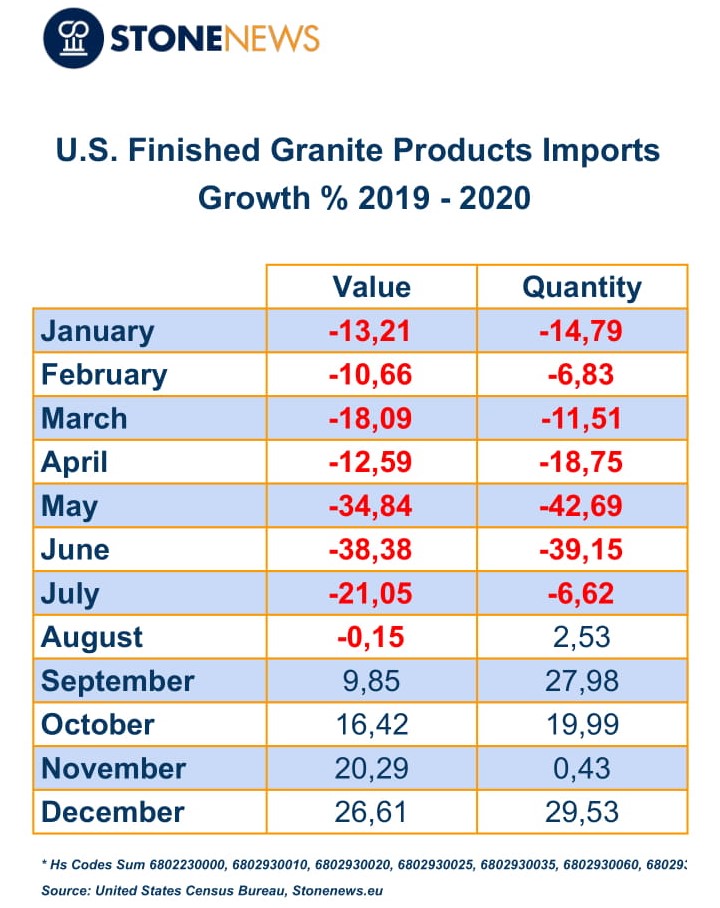 In the Table we observe that the course of granite imports is similar to that of marble, falling in the first half and rising in the second. Between January – June 2020 there was a decrease in value by -28.73% and in quantity by -27.6%. On the contrary, between July – December, an increase of + 14.01% in value was recorded, while in the quantity there was a marginal decrease of -0.24%.
In the States with the highest value of imports in 2020, North Carolina recorded an increase of + 17.44% and Georgia + 2.07%. Texas fell by -6.48%, California -18.78%, Florida -6.99% and New Jersey -21.43%.
* The statistics are derived from the analysis of the Harmonized System (HS) Codes:
6802215000: Marble a alabaster mnmntl bldg smply ct o swn w flat o evn surface.
6802910500: Marble slabs.
6802911500: Marble, other than slabs.
6802230000: Granite Mon Or Bldg Stone Smply Cut Or Sawn (t).
6802930010: Granite, mnmtl / bldg, nt Ct Sz, 1 Fc Wrkd, mr Th Ct / swn (t).
6802930020 Granite, mntl / bldg, ct Sz, wrkd Mr Thn Ct / swn, max 1.5 (t).
6802930025: Granite, mntl / bldg, ct Sz, etc, mx Thk Ov 1.5 Nov 7.5 (t).
6802930035: Granite Monuments, bases, markers, over 7.5 Cm Thick (t).
6802930060: Granite, Mntl / bldg, ct Sz, etc, Ov 7.5 Cm Thck, nesoi (t).
6802930090: Granite, Nesoi (t).
*Due to consistent data flow, statistics may alter during the year
For more statistics contact [email protected]