


According to the World Economic Outlook Report, released in July 2019, global growth is subdued. During this year, the United States increased tariffs on certain Chinese imports and China answered by raising tariffs on a group of US imports, global technology supply chains were threatened by the prospect of US financial sanctions, Brexit-related uncertainty continued, and rising geopolitical tensions roiled energy prices. However, the report projects that global growth will close at 3.2 % in 2019, increasing to 3.5 % in 2020 (0.1 % lower than April’s WEO predictions for both years).
International Monetary Fund ranges the countries around the world by their GDP. The several economic games affect global economies, changing their ranking through years. It is important though that the nominal GDP of the top 10 economies adds up to about 66% of the world’s economy, while the top 20 economies contribute almost 79%. These economies are the engine of growth, commanding a majority of the global wealth.


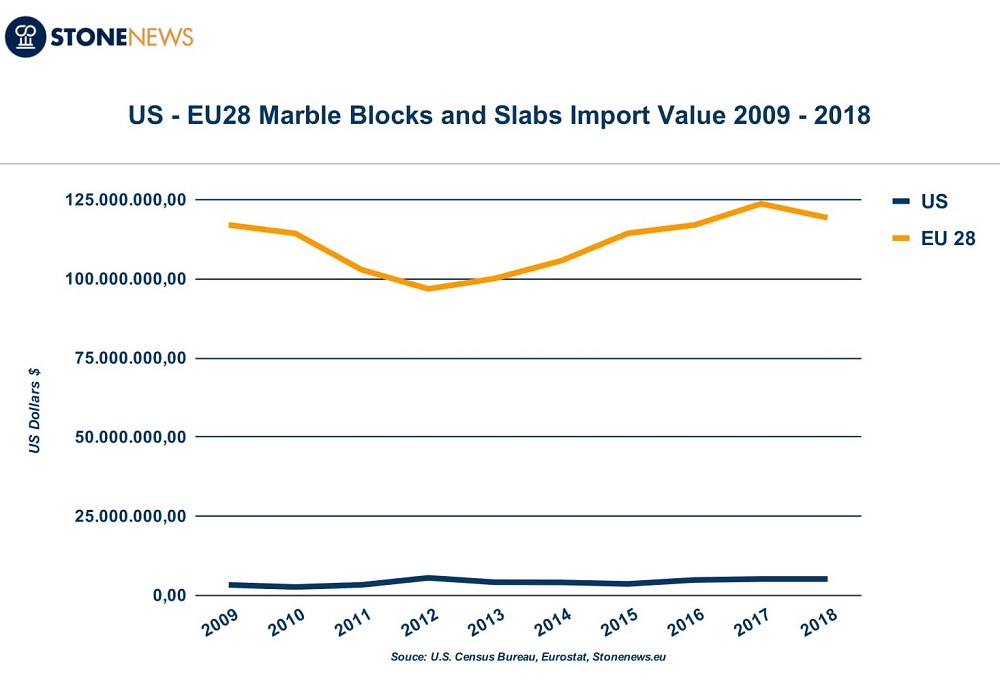
The largest economies in the world, based to their GDP, are the US and the EU28. US comes first with $20.50 trillion GDP in 2018, while EU’s GDP was estimated at $18.8 in 2018, representing almost 22% of global economy. Exports are essential for economic growth. But what about those economies’ imports, especially on the sector of our interest, marble sector? What was the progression of US and EU marble imports, both in blocks and slabs as well as finished marble products, from 2009 to 2018?
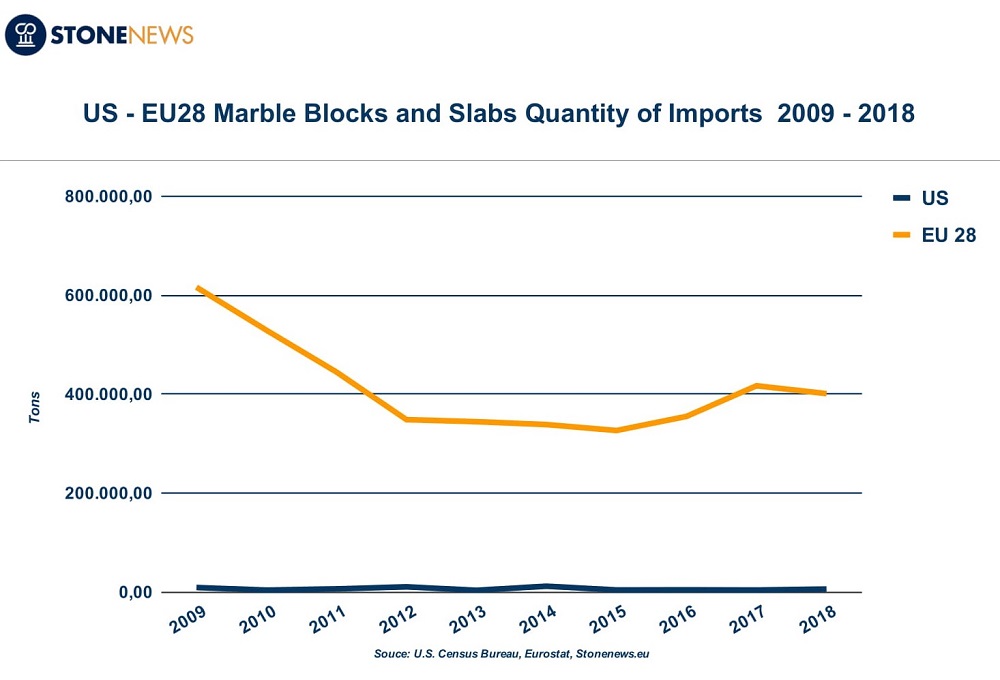
EU28 has been far more active than the US in marble blocks and slabs imports both in value and quantity of imports through the decade 2009-2018. The graphs below show the progression of imports firstly in value and secondly in quantity of imports of the two economies.
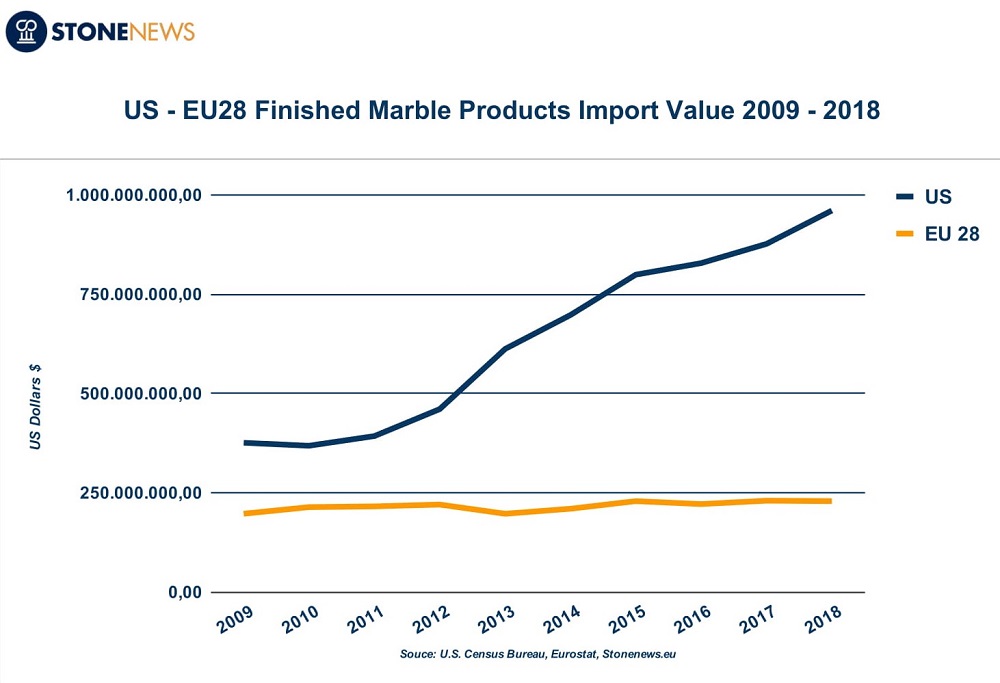
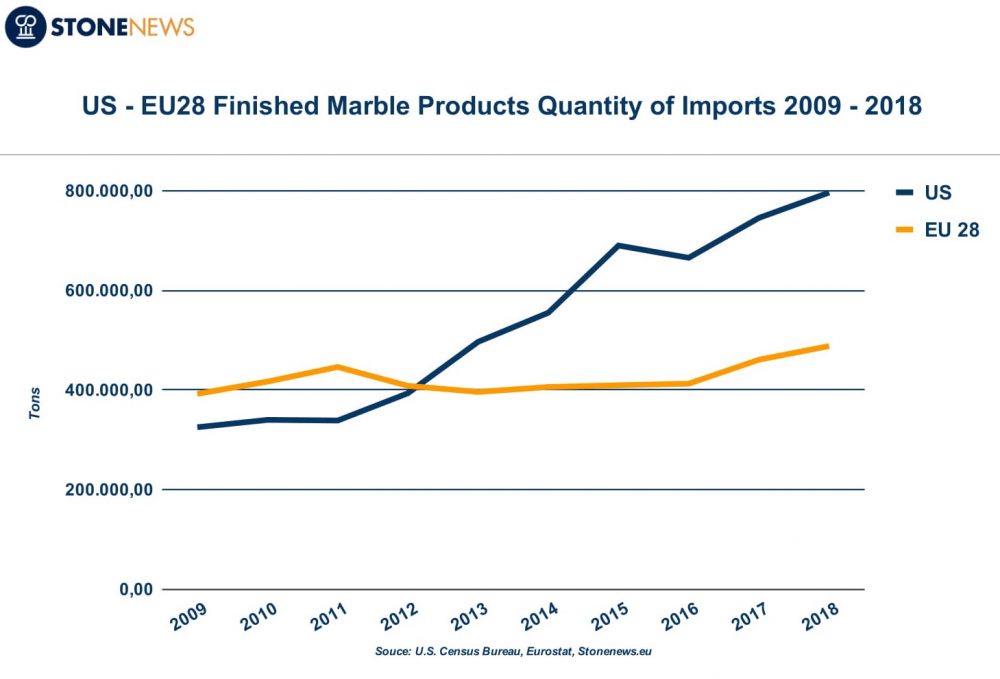
 The roles are reversed when it comes for finished marble products imports. The US hold the lead in finished marble imports value through the years 2009-2018, having an obvious strong upgoing trend mainly after 2012 till today. The upward trend of US finished marble products imports between 2009-2018 is also reflecting in quantity of imports, as seen at the graph below. 2012 was a key year again, as the numbers started their upturn since then.
 Stay tuned to discover what the two largest economies in the world achieved in marble imports during the first nine months of 2019!