

Following the article about US and EU28 marble imports growth from 2009 to 2018, Stonenews.eu is presenting you the US and EU28 marble imports growth during the first nine months of 2019, both for marble blocks and slabs as well as finished marble products, based in value and quantity of imports.
EU28 holds the lead in marble blocks and slabs imports in the first nine months of 2019, too. The US imports are just minimal when compared to the EU’s. April has been significant for EU’s imports as it is the month initialising the increase in marble blocks and slabs imports value, concluding in September in higher level than in January 2019. Despite fluctuations, quantity of marble blocks and slabs imports of the EU28 remained over 30,000 tons in most of 2019.


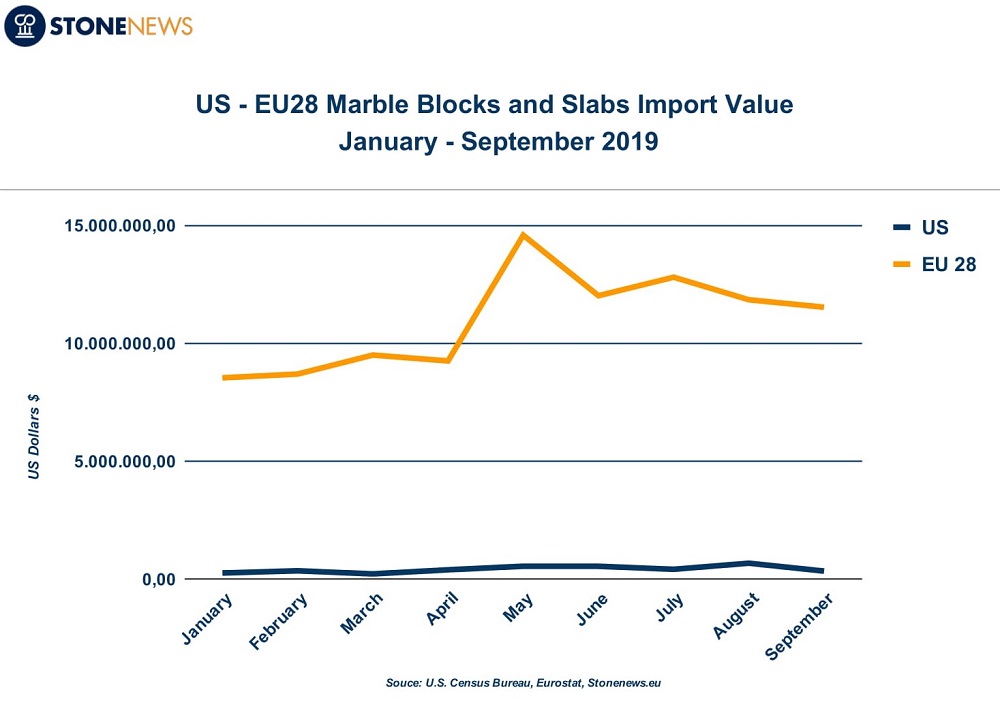
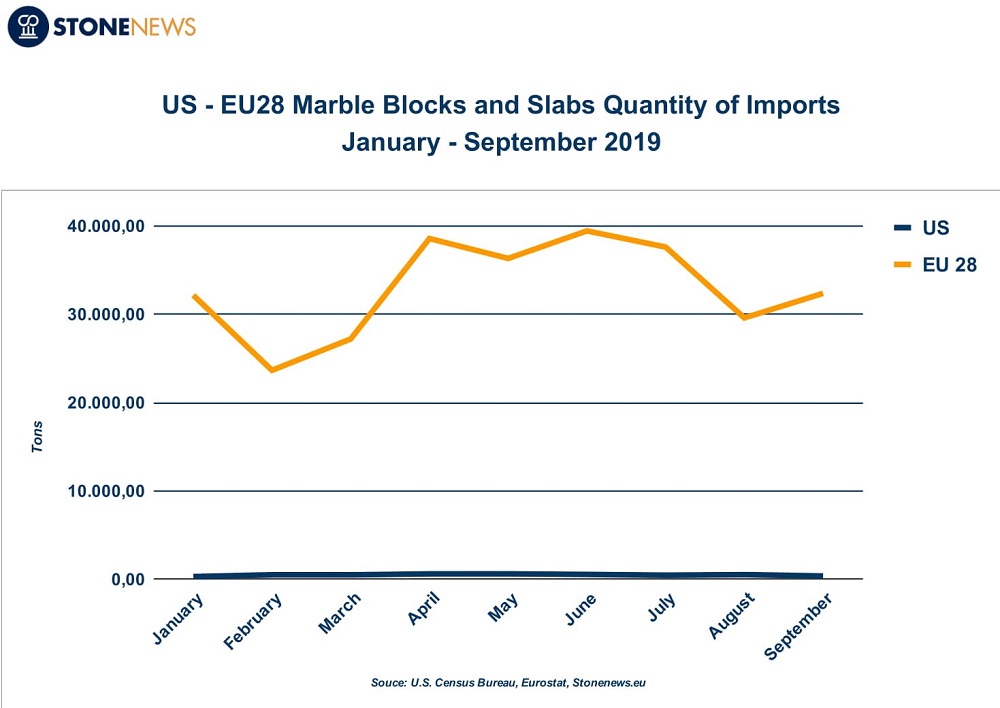 The top marble blocks and slabs suppliers of the US in 2019, based in quantity, are Canada, Italy and China, while EU’s top suppliers are Turkey, North Macedonia and Iran.
As for finished marble products, US imports more than the EU28 both in value and quantity of imports. After suffering a fall in February, the US finished marble products imports recovered presenting increase from month to month until August, when a new downfall started. Same situation for the US quantity of imports. On the contrary, the EU’s finished marble products import value remained rather stable, lower though than the US. Upward trend for EU’s quantity of finished marble products imports, as shown at the graphs below.
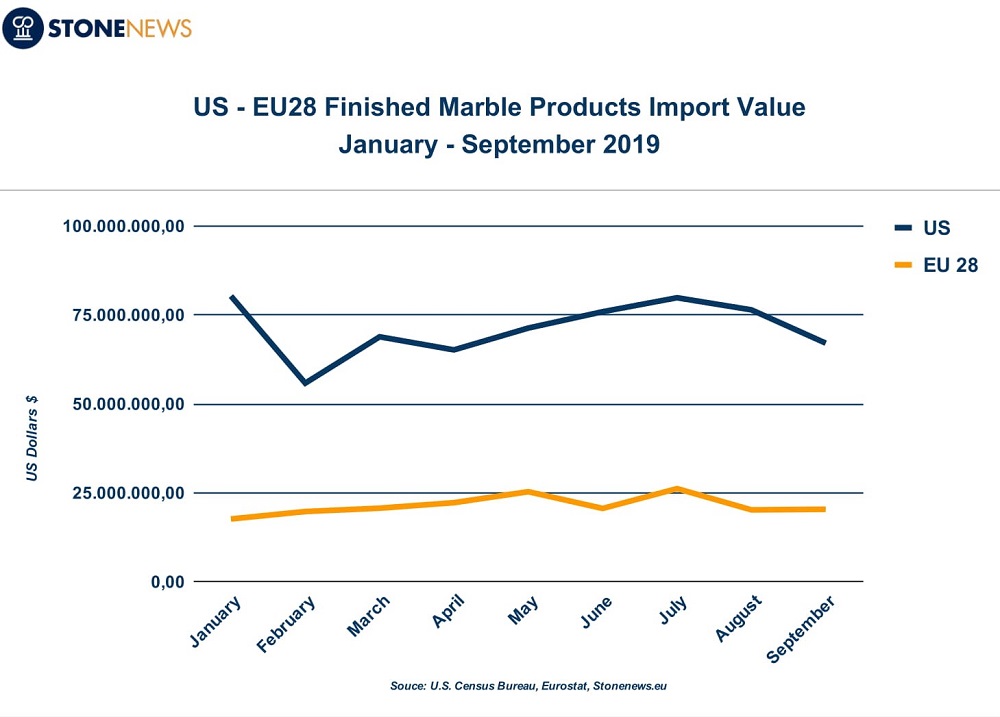
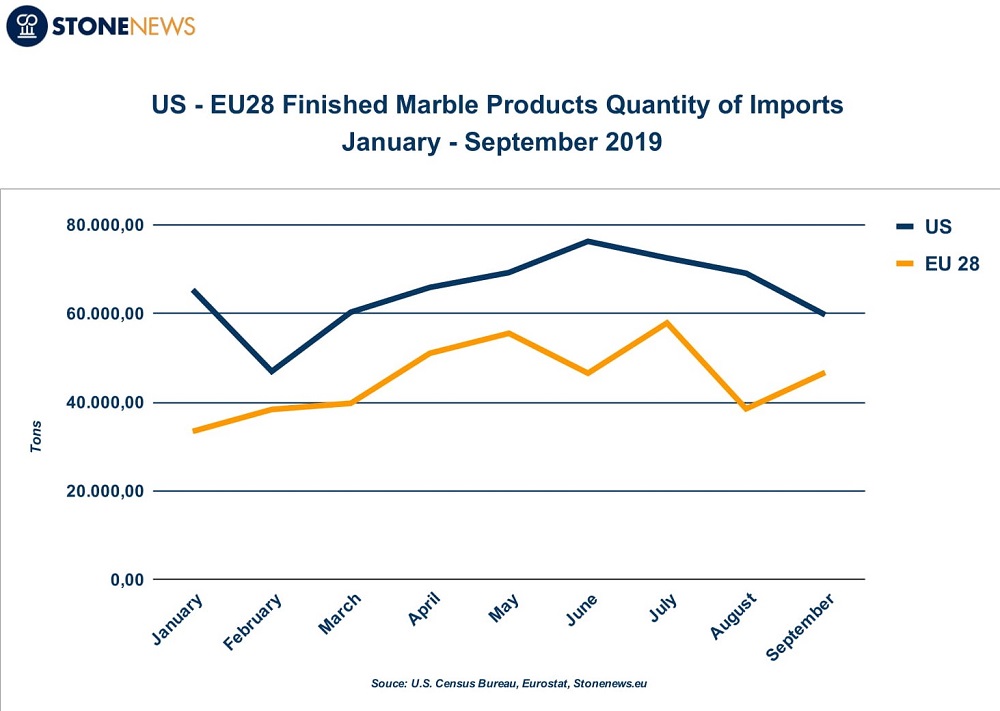
The top finished marble products suppliers of the EU28 in 2019 are Turkey, China and Egypt, while the US top suppliers are Italy, China and Turkey.
*Due to consistent data flow, statistics may alter during the year