


USA’s Imports of finished marble products and granite decreased from China after the imposition of additional duties and the COVID-19 pandemic?
On September 24, 2018, President Trump announces the imposition of additional tariffs of 10% by the end of the year, which will then increase to 25%, on products imported from China worth about $ 200 billion. Among the products are marble, granite and slate. Natural stones enter US trade war. – China, marking the most significant change in recent years in the balances of the world market.


USA. is the largest importer of finished marble products and granite while China is the largest exporter. It is clear, then, that trade relations between them have a decisive influence on the global natural stone market.
The outbreak of the pandemic in the midst of the trade war further complicates the market. China is recovering strongly from the pandemic while the US are affected more than any other country on the planet. However, statistics from recent months show that US imports recover.
With these data, Stonenews.eu, after researching and analyzing the statistics of the United States Census Bureau, presents the course of USA’s imports of finished marble products and granite from China in the period October 2018 – 2020.
Marble
The impact of the trade war and the COVID-19 pandemic is reflected in US import marble statistics from China. In the Chart that follows we see the course of total imports of finished marble products from the US in relation to imports from China between October 2018 – 2020.
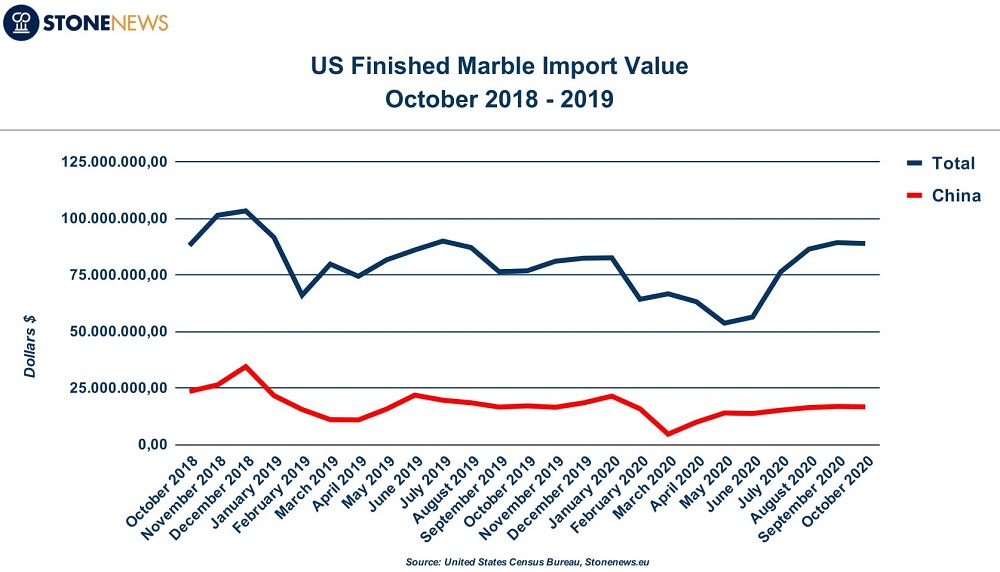 Between October 2018 and December 2019, imports from China recorded a decrease of -21.68% while in total -6.4%. From January 2020 to October, during the pandemic, imports from China fell -22.25% compared to total, which increased by + 7.66%.
In the period October 2018 – 2020 they record a decrease of -29.26%. On the contrary, the total imports showed a marginal increase by + 0.97%. China’s share of total US marble imports in October 2018 it was 26.67% while in October 2020 it stood at 18.68%.
It should be noted that during the same period, imports from Italy decreased by -12.01%. Statistics show that India, Brazil, Turkey and Greece accounted for shares in China and Italy.
Granite
In the USA’s imports of processed granite from China the effects of the trade war and the COVID-19 pandemic are significant. In the Chart that follows we see the course of total imports of processed granite from the USA. in relation to imports from China between October 2018 – 2020.
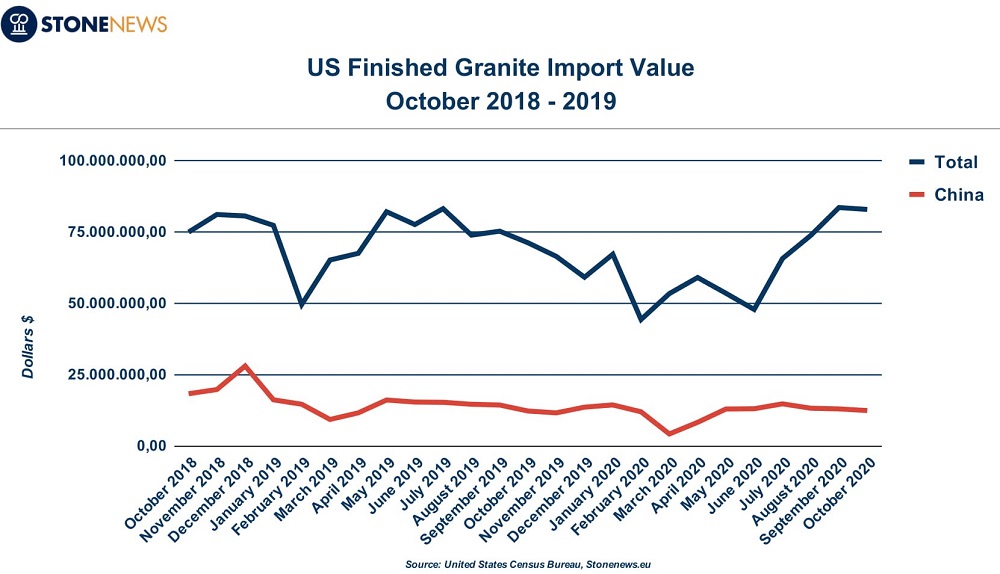 Between October 2018 and December 2019, imports from China recorded a decrease of -25.8% while in total -21.11%. From January 2020 to October, during the pandemic, imports from China fell -13.72% in contrast to total increases by + 23.41%.
Between October 2018 – 2020, imports from China recorded a decrease of -32.32%. On the contrary, total imports increased by + 10.63%. China’s share of total US granite imports in October 2018 it was 24.34% while in October 2020 it stood at 14.89%.
China is the only country among the major suppliers of the United States, Brazil and India, to record a decline. In the period October 2018 – 2020, imports from India increased by + 46.22% and from Brazil + 19.12%.
China’s share was mainly occupied by India and less by Brazil. India is the second largest US supplier since 2019. after Brazil.
Closure
Imports of processed marble and granite from China in the period October 2018 – 2020 record a decrease of -30.60%. On the contrary, the total imports showed a marginal increase by + 5.41%. It is clear that the imposition of additional duties has led to a drastic reduction in imports from China. The pandemic mitigated the decline in the first nine months of 2020 by finalizing the reclassifications in the shares of the major US marble and granite suppliers.