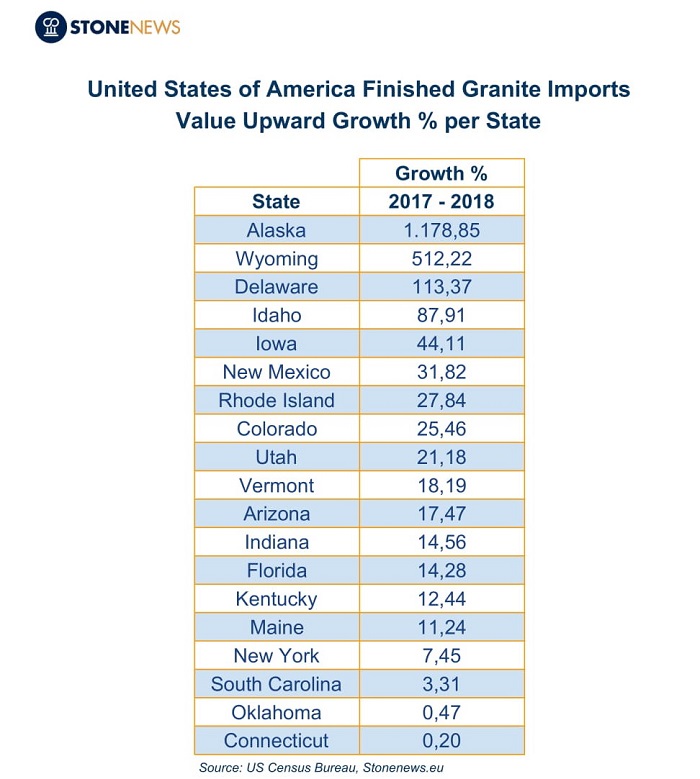
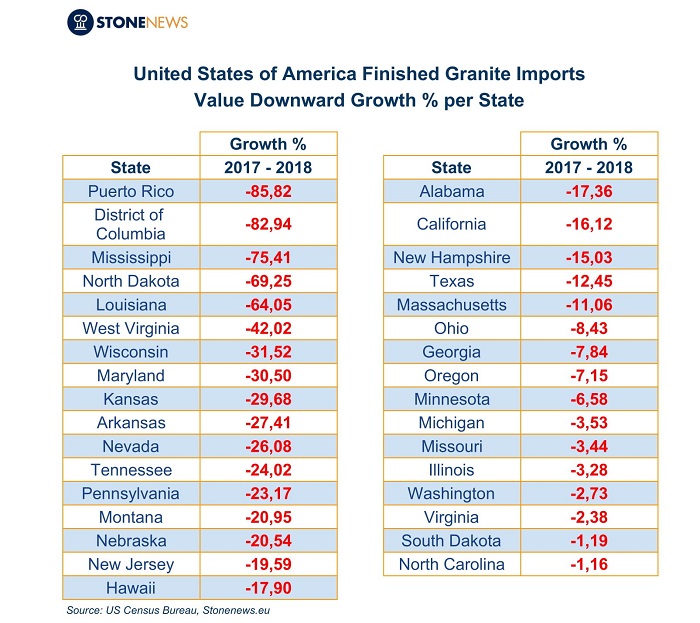
The USA is one of the main producers of granite together with Brazil, India, China and Italy. However, not all of the granite used in the US comes from quarries across the country. Finished granite is mostly imported and in 2018 it came from Brazil (43.2%), China (24.8%) and India (18.2%). But what was the trend in US granite import value per state in 2018?
The total value of US finished granite imports in 2018 stood at $ 899.32 million, decreased by -10.49% from 2017.
Stonenews.eu, after studying the statistical results* of the International Trade Centre, the UN Comtrade and the National Statistical Institutes, is presenting the growth of US finished granite imports per state in 2018.
 As presented at the table, the state with the greatest upward growth in finished granite imports in 2018 was Alaska by the impressive 1,178.85%!!! Wyoming comes second with a 512.22% growth in finished granite imports, followed by Delaware with 113.37% growth.
 On the contrary, Puerto Rico had the most significant downward trend in finished granite imports in 2018 decreased by -85.82%, followed by Columbia District whose finished granite imports fell by -82.94% compared to 2017. Mississippi holds the third place with a decrease of -75.41%.
* Due to consistent data flow, statistics may alter during the year
** The statistics are derived by the HS Codes below (Harmonized System Codes):
680293: Granite, in any form, polished, decorated or otherwise worked (excluding tiles, cubes and similar articles of subheading 6802.10, imitation jewellery, clocks, lamps and lighting fittings and parts thereof, original sculptures and statuary, setts, curbstones and flagstones).
680223: Granite and articles thereof, simply cut or sawn, with a flat or even surface (excluding with a completely or partly planed, sand-dressed, coarsely or finely ground or polished surface, tiles, cubes and similar articles of subheading 6802 10 00, setts, curbstones and flagstones).


