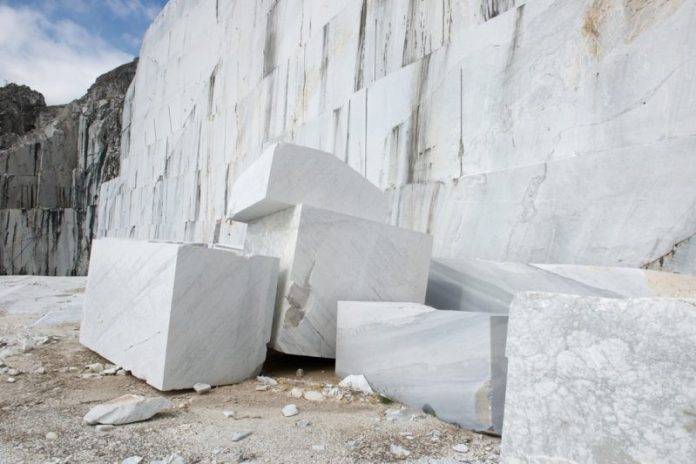
The 2022 results for sector and the Italian unprocessed natural stone exports are excellent.
In 2022, Italian exports of unprocessed materials increased by 2.1% in value compared to the same period in 2021.
China remains the top buyer but decreased its imports by 10.2%, while India, in second place, increased its imports from Italy by more than 75.8%.
Egypt is in third place in the import of raw materials (+24.6%), ahead of Germany (+11.7%), Algeria (+52.7%), United States (-62.1%), Switzerland (+10.09%), France (-10.4%), Indonesia (+77.8%) and Taiwan (-28.1%).
A positive result in 2022 for the Italian export of slabs and processed natural stones sector during this period is that China imported about 45.5% of all exported Italian raw materials and about 3.5 times the quantities imported from India.
In 2022, the value of Italian exports of slabs and finished products increased by 15.8% compared to the same period of the previous year.
Exports of these products to the United States (1) increased by 26.1%, in Germany (2) by 13%, in France (3) by 15%, in Switzerland (4) by 8.9%, in Saudi Arabia (5) by 31.8%, in the United Arab Emirates (7) by 23.1%, in Austria (8) by 4.7%, in Australia (9) by 13.4% and in Canada (10) by 16.6% while they decreased in the United Kingdom (6) by 5.7%.
It is important to remember that in 2022, the Italian export of slabs and finished products in the top ten Buyer Countries was about 82% of the total export of these products (1,747 billion euros). Italian exports to the United States (1) were over 3.1 times the exports to Germany (2) and over 4.8 times the exports to France (3).
In 2022, the value of Italian exports of machines, tools and other equipment for natural stone processing increased by 1.7% compared to the same period of the previous year.
If we consider the “top ten” of the main buyers of Italian machinery and equipment, our sales increased in the United States by 42.1% (1), in Germany by 10.9% (3), in India by 66.9% (4), in France by 12.3% (5), in Turkey by 48.4% (6), in Canada by 10.1% (8) while they decreased in Spain -14% (2), in Poland by 18.1% (7), in the United Kingdom by 14.7% (9) and in Portugal by 26.1% (10).
Outside the ranking of the top ten countries investing in Italian technology is Brazil, which in terms of investment in Italian machinery and equipment in this period, was overtaken by Portugal.
Source: Markets Trends Analysis Office CONFINDUSTRIA MARMOMACCHINE Association


