


The $88 Trillion World Economy in One Chart
The global economy can seem like an abstract concept, yet it influences our everyday lives in both obvious and subtle ways. Nowhere is this clearer than in the current economic state amid the throes of the pandemic.
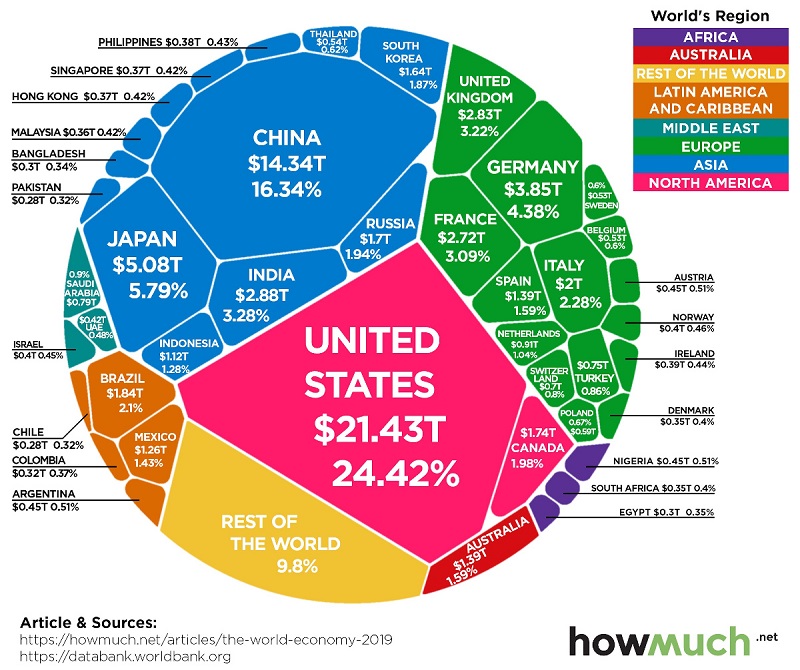
This voronoi-style visualization from HowMuch relies on gross domestic product (GDP) data from the World Bank to paint a picture of the global economy—which crested $87.8 trillion in 2019.


Top 10 Countries by GDP (2019)
In the one-year period since the last release of official data in 2018, the global economy grew approximately $2 trillion in size—or about 2.3%.
The United States continues to have the top GDP, accounting for nearly one-quarter of the world economy. China also continued to grow its share of global GDP, going from 15.9% to 16.3%.
| Rank | Country | GDP | % of Global GDP |
|---|---|---|---|
| #1 |  U.S. U.S. | $21.4T | 24.4% |
| #2 |  China China | $14.3T | 16.3% |
| #3 |  Japan Japan | $5.1T | 5.8% |
| #4 |  Germany Germany | $3.9T | 4.4% |
| #5 |  India India | $2.9T | 3.3% |
| #6 |  UK UK | $2.8T | 3.2% |
| #7 |  France France | $2.7T | 3.1% |
| #8 |  Italy Italy | $2.0T | 2.3% |
| #9 |  Brazil Brazil | $1.8T | 2.1% |
| #10 |  Canada Canada | $1.7T | 2.0% |
| Top 10 Countries | $58.7 trillion | 66.9% |
In recent years, the Indian economy has continued to have an upward trajectory—now pulling ahead of both the UK and France—to become one of the world’s top five economies.
In aggregate, these top 10 countries combine for over two-thirds of total global GDP.
Projections Going Forward
According to the World Bank, the global economy could ultimately shrink 5.2% in 2020—the deepest cut since WWII.
See below for World Bank projections on GDP in 2020 for when the dust settles, as well as the subsequent potential for recovery in 2021.
| Country/ Region / Economy Type | 2020 Growth Projection | 2021E Rebound Forecast |
|---|---|---|
| United States | -6.1% | 4.0% |
| Euro Area | -9.1% | 4.5% |
| Advanced economies | -7.0% | 3.9% |
| Emerging economies | -2.5% | 4.6% |
| East Asia and Pacific | -0.5% | 6.6% |
| Europe and Central Asia | -4.7% | 3.6% |
| Latin America and the Caribbean | -7.2% | 2.8% |
| Middle East and North Africa | -4.2% | 2.3% |
| South Asia | -2.7% | 2.8% |
| Sub-Saharan Africa | -2.8% | 3.1% |
| Global Growth | -5.2% | 4.2% |
Source: World Bank Global Economic Prospects, released June 2020
Editor’s note: Annual data on economic output is a lagging indicator, and is released the following year by organizations such as the World Bank. The figures in this diagram provide a snapshot of the global economy in 2019, but do not necessarily represent the impact of recent developments such as COVID-19.
Source: www.visualcapitalist.com