


Since 2015, finished granite imports in the US have followed a downward trend in terms of import value, leading to finished marble prevalence against granite in 2018. This trend seems to have continued in 2019, too, though quantity of finished granite imports in the US is still dominant over marble.
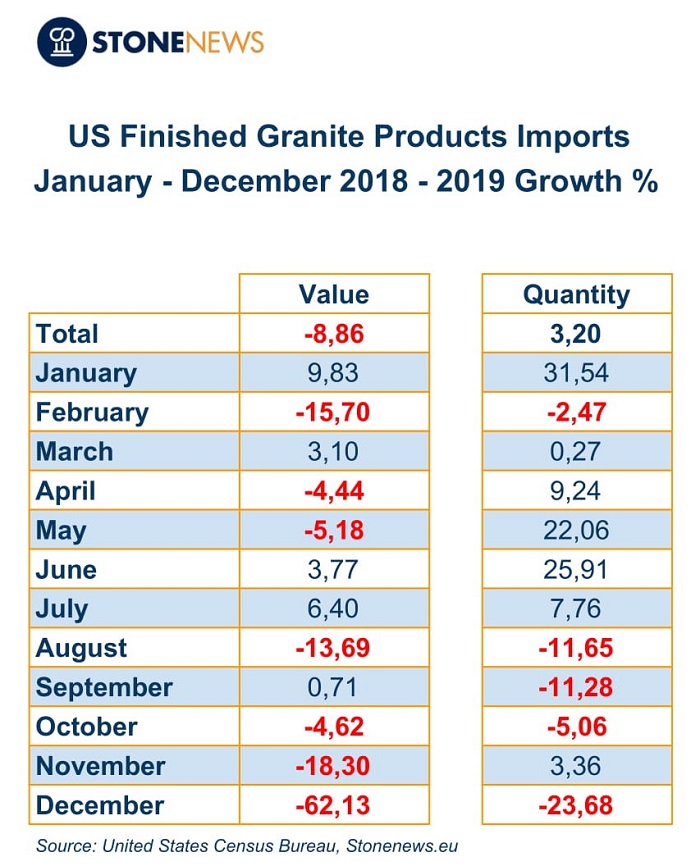
Stonenews.eu, after collecting and analysing the relevant statistical data from US Census Bureau, is presenting the US finished granite imports growth during 2019 compared to 2018. The table below is indicative of the overall declining course in finished granite import value. December 2019 is by far the champion of decline scoring – 62.13% compared to December 2018, followed by November with – 18.30%. As for quantity of imports, there were fluctuations from month to month. The 31.54% increase in January 2019 compared to 2018 and the -23.58% decrease in December 2019 were the greatest positive and negative rates respectively.


 The picture is clearer in the graphs below.
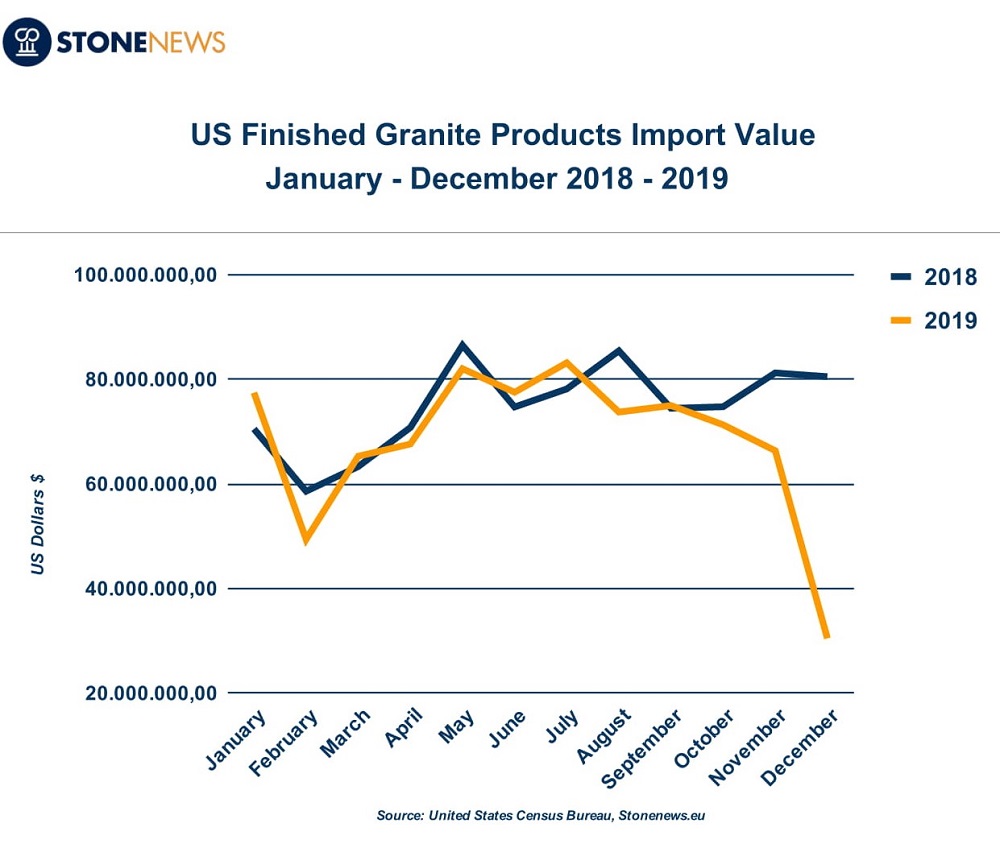
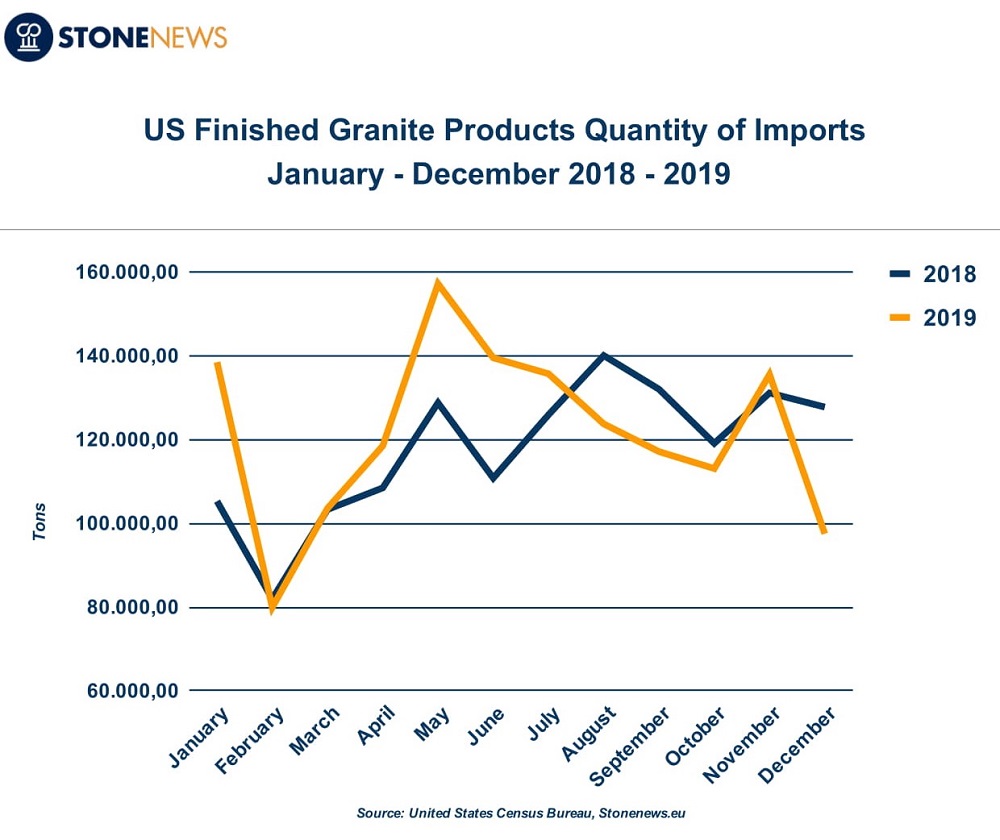 It is worth mentioning that during 2019, the US imported finished granite products of $819.85 million worth reflecting to 1.45 million tons of imported granite.
*Due to consistent data flow, statistics may alter during the year
**The statistics are derived by the HS Codes below (Harmonized System Codes):
6802230000, 6802930010, 6802930020, 6802930025, 6802930035, 6802930060, 6802930090